
HAPPY CAUTIOUS HOLIDAYS
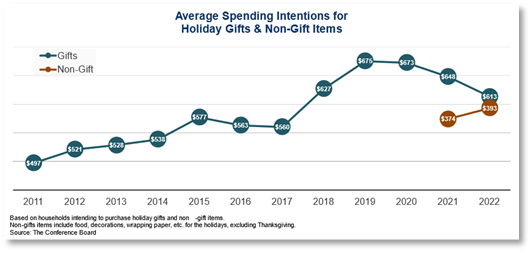
The Conference Board released their Holiday Spending Survey and found that as a result of “economic uncertainty and high inflation, US consumers intend to spend an average of $613 on holiday gifts this year, down from $648 last year.” In contrast, they’re expected to spend more money on “nongift items” (e.g. food, decorations, and wrapping paper); up from $374 in 2021 to $393. Shifts in spending include increases in gift cards, toys & games, and vacation travel, and decreases in home décor, appliances, jewelry & accessories, and tools & hardware. (The Conference Board: 11/1/22)
POLITICAL AD SPENDING
Election Day is less than two weeks away, and about a quarter of political advertising budgets are still to be spent. This year, the placement of political ad campaigns has changed as social media, such as Facebook and YouTube, have “tightened their rules” and TikTok and Adobe have even banned political advertising. On TV, political ads “have found a new home on connected TV”, where hyper-targeting offers candidates with smaller budgets the ability to run commercials on TV. Tactics include “in-person retargeting” where door-knockers show up in areas after political ads have been shown, and identifying people on their commute. (Ad Exchanger: 10/27/22)
SYNDICATION ROUNDUP
The week ending 10/23 saw “strong competition and preemptions from six Major League Baseball playoff games”, but that didn’t stop Judge Judy from scoring. Topping the charts, among court shows, Judge Judy rose 8% over the previous week, “to a formidable 4.1 live-plus-same-day national Nielsen rating and more than 6 million daily viewers.” Other strong showings in the genre included Hot bench, up 8% to a season-high of 1.3, and People’s Court with a season-best 0.8. Among talk shows, Live with Kelly and Ryan took the top spot (1.6), followed by Dr. Phil (1.4), Kelly Clarkson (0.9), and Drew Barrymore (0.8). Top shows across other categories are included for news magazines, sitcoms, and hour-long programming. (TVNewscheck: 11/1/22)
AVOD VS. SVOD AUDIENCES
Netflix and Disney+ are predicting new subscribers with their launch of reduced-price ad-supported streaming tiers (AVODs) but the new subscribers “may not be significantly different audience pools, demographically, than those of their premium subscription-based tiers (SVODs).” Among household incomes under $50,000, 33% of subscribers will choose ad-supported and 31.9% will choose ad-free, while for household incomes of over $150,000, 16.8% prefer ad-supported and 18.8% prefer ad-free. More females skew ad-supported at 53.4% compared to 48.8% ad-free. As for ethnicity, “both are 67%-plus White, about 16% to 17% Hispanic, 11% to 12% Black, and 4% Asian.” (MediaPost: 11/1/22)
CTV SHARED VIEWING
New research from the streaming service provider, Amagi reports that “nearly 80 percent of CTV viewing is shared viewing”, with two people watching together 62% of the time and three people watching the screen 15% of the time (the balance is four or more people). Watching TV with others, whether linear or streaming, is how most people have watched TV for decades. However, the shared experience is less common on mobile or computer screens, which makes it easier “to infer audience interest and target ads extremely tightly.” Since “CTV is considered better for ad targeting than traditional linear TV, but shared screens mean some of that targeting is ‘wasted’” then this could “affect CTV pricing power.” (TV REV: 10/31/22)

