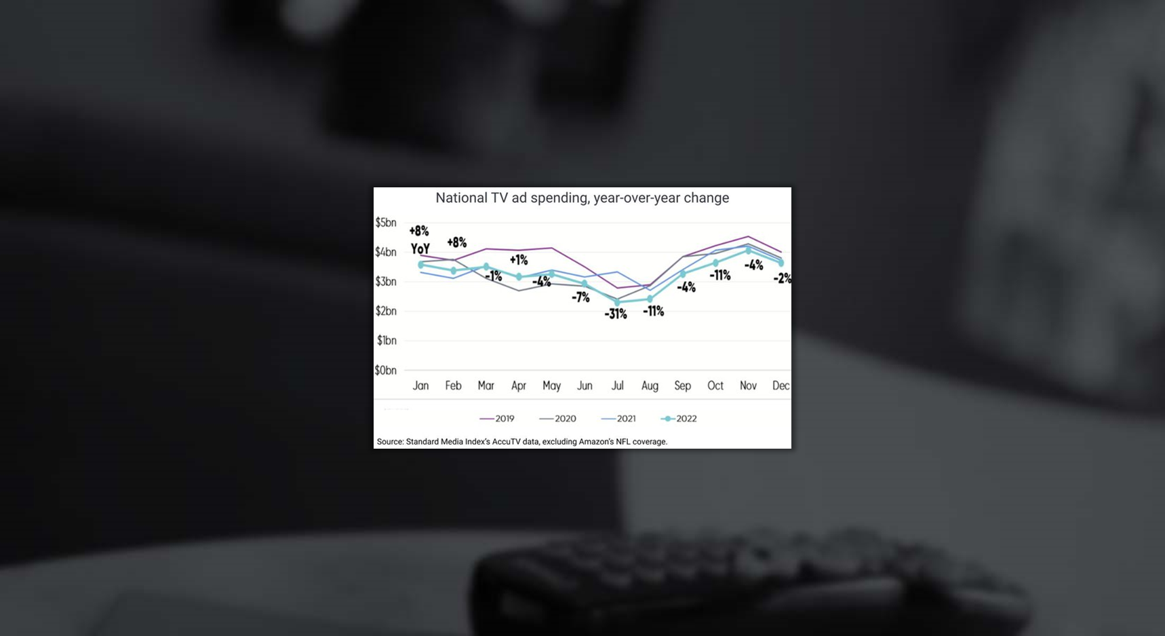
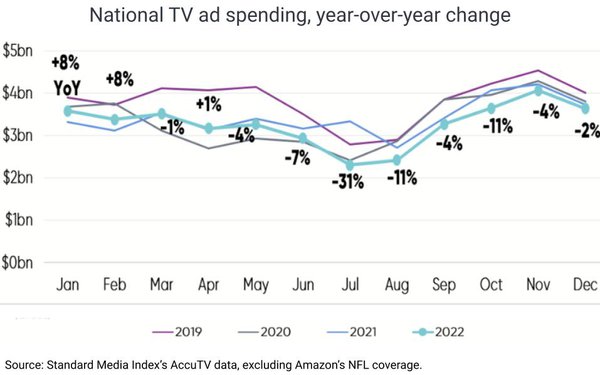
NATIONAL LINEAR TV AD SPENDING
According to Standard Media Index, December national linear TV ad spending reached approximately $3.7 billion; a 2% decline vs. the previous year. While the fourth quarter marketplace was down 6%, it’s an improvement from the third quarter’s 16% decline. And while the calendar year 2022 was down 5%, the inclusion of media buys for national TV deals from streamed NFL content and Amazon Prime Video’s Thursday Night Football, national TV spending grew 2%. Consumer packaged goods, general business, and entertainment marketers showed growth, while retail, financial services, and technology marketers saw a decrease. (MediaPost: 1/30/23)
TV MEASUREMENT UPDATES
Two days before the launch of Nielsen’s long-awaited cross-platform measurement product “four of the largest TV networks came together to form a committee focused on enabling multiple currencies and streaming measurement solutions”. The four networks, Fox, NBCUniversal, Paramount, TelevisaUnivision, and Warner Bros. Discovery, formed the Joint Industry Committee or JIC. While Nielsen will no longer be the sole measurement source, it’s not going anywhere. However, “the JIC sees the traditional TV community coming together to reduce Nielsen’s monopoly power.” (MarketingDive: 1/30/23)
SYNDICATION RATINGS: GAMESHOWS DOMINATE
The syndication week that ended on January 22nd was dominated by the popular game shows Jeopardy!, Wheel of Fortune, and Family Feud. All three reached a 5.0 household rating. Daytime TV’s positive column consisted of The Kelly Clarkson Show “which matched its season high with an 11% surge to a 1.0 and was the third most-watched strip in the category.” Also, Drew Barrymore “had its best week ever in the advertiser-coveted women 25-54 demo.” Live with Kelly and Ryan remained a leader for the 35th straight week and received a 1.7 household rating. The 3 top shows for the week among women 25-54 were: Live with Kelly and Ryan, Dr. Phil, and Drew Barrymore. (TVNewsCheck: 1/31/23)
REPRESENTATION IN TV & VIDEO ADS
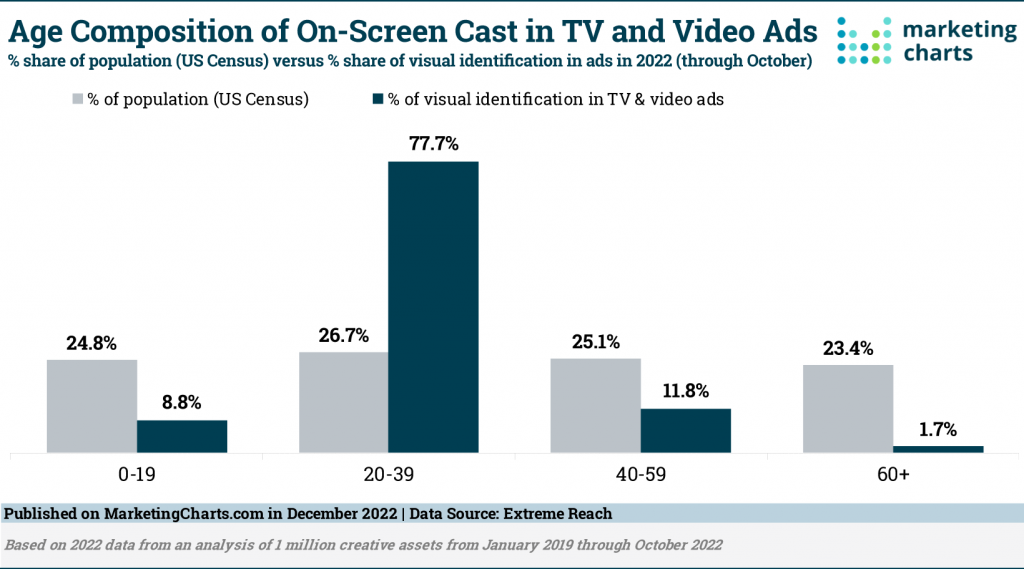
The representation of women and older adults in TV and video advertising has declined in recent years, according to research by Extreme Reach. The study found that male cast members visually outnumbered females on an almost 2:1 basis or 65.2% vs 34.8%. When listening just to the audio, the balance was even more dramatic, with males representing 73.4% of voices heard and females making up 26.6% of the voices. Other categories where male representation was higher than female include TV, film and music, technology, and automotive verticals, despite being lower than average for consumer goods, pharma & healthcare, and retail verticals. The study also supports the notion that advertisers emphasize youth finding that 20-39-year-olds constituted a remarkable 77.7% share of on-screen cast members in TV and video ads; nearly three times their 26.7% share of the US population. Conversely, the 60+ bracket was under-represented accounting for just 1.7% of on-screen casts even though they make up 23.4% of the US population. (MarketingCharts: 1/30/23)

