ECONOMY
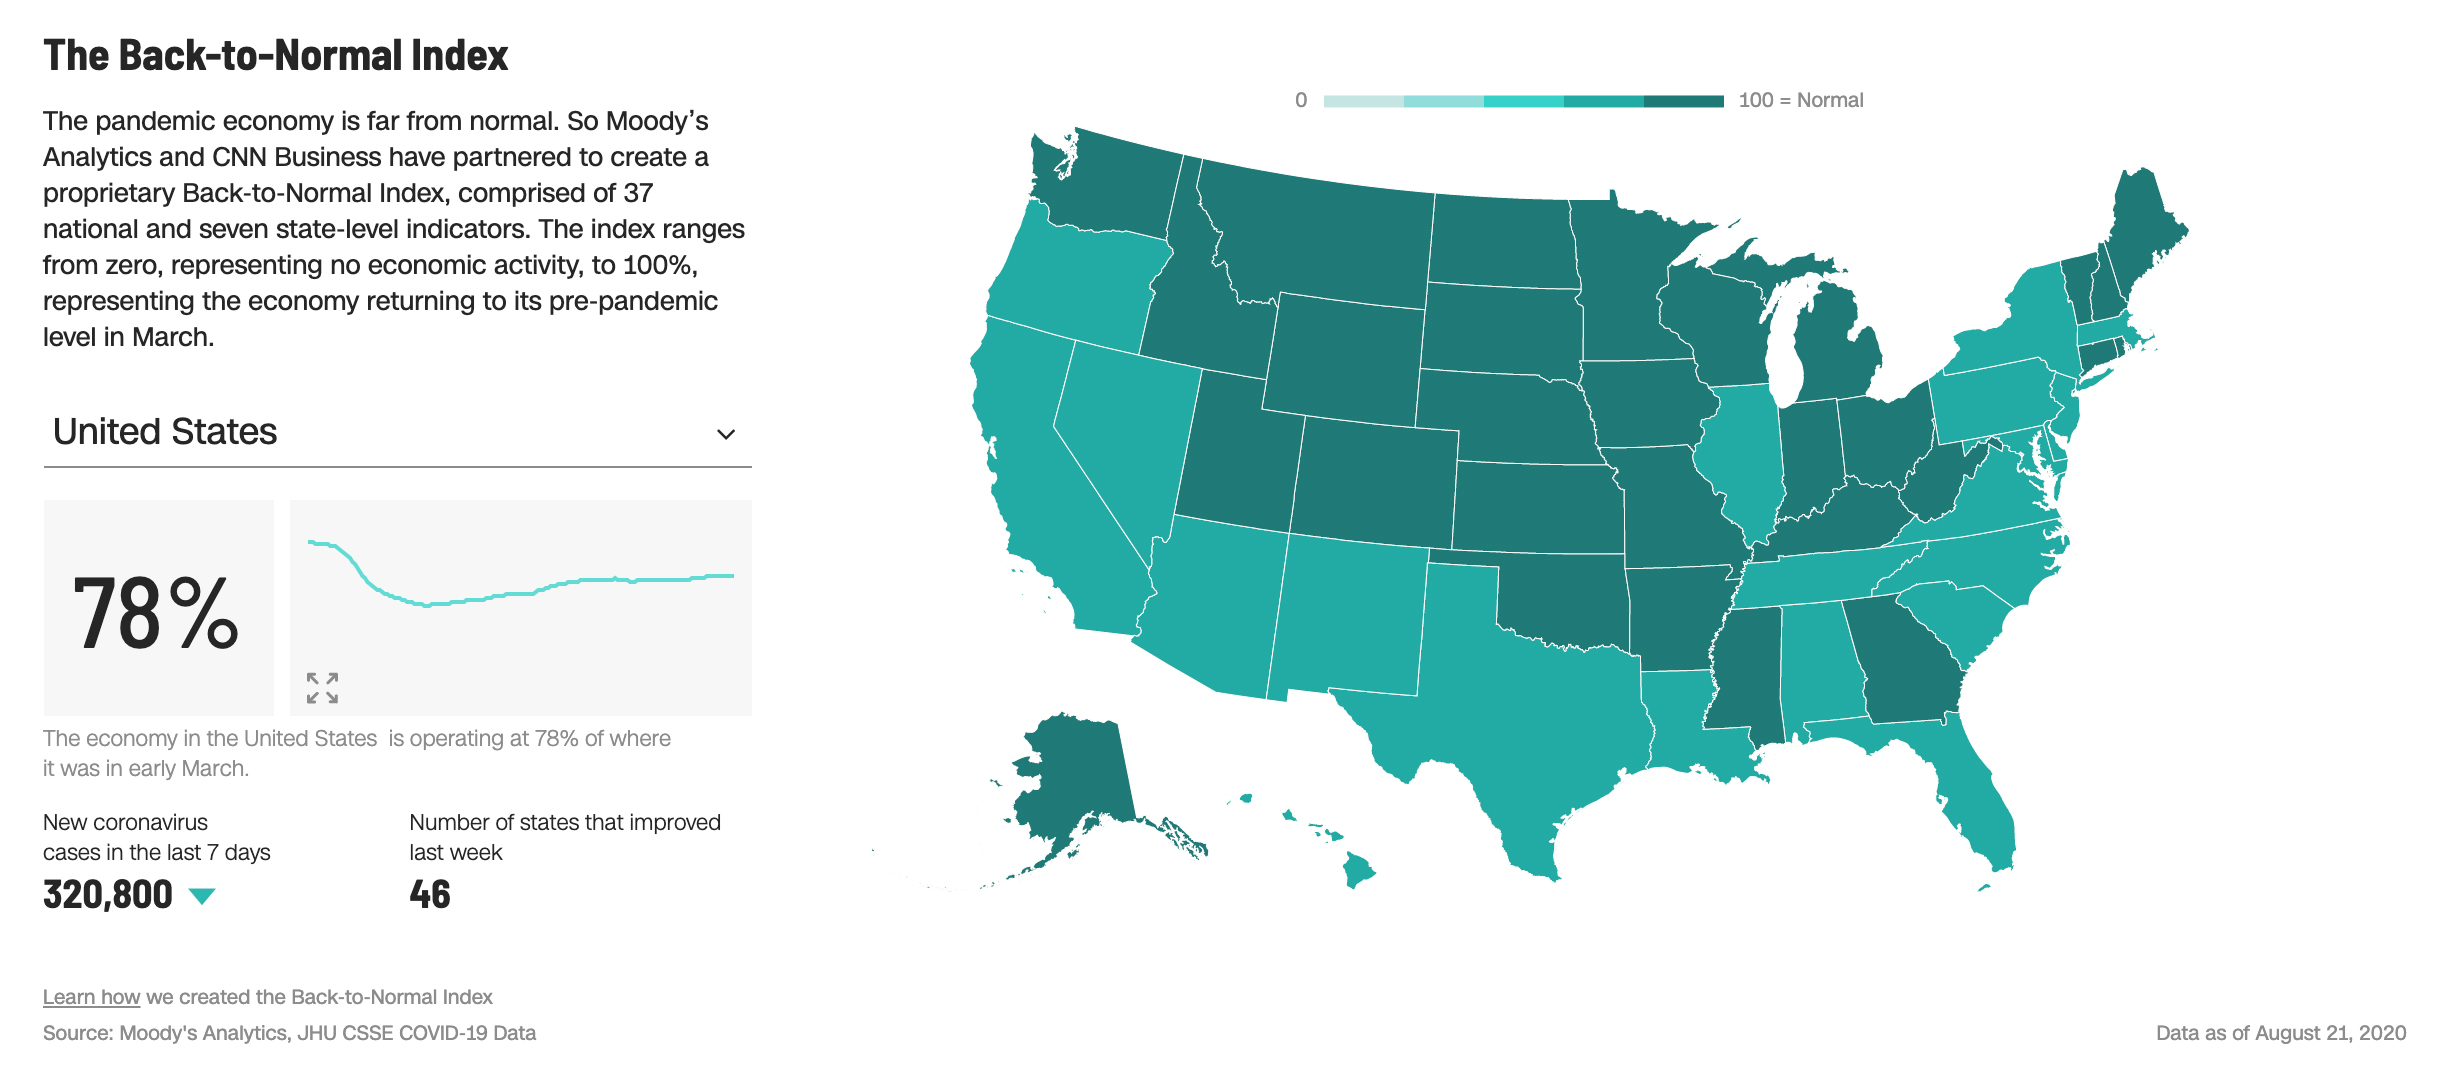
Moody’s Analytics and CNN Business partnered to create their proprietary “Back-to-Normal Index”, an interactive map comprised of 37 national and seven state-level indicators. The index ranges from zero, representing no economic activity, to 100%, representing the economy returning to its pre-pandemic level in March. In addition to the clickable map on the right, visitors can track America’s recovery with a timeline for each state, compare the number of new coronavirus cases in the last 7 days, and identify areas of improvement. The graphic, updated through 8/21 at the time of this distribution is based on Johns Hopkins University COVID-19 Data.
VIEWERSHIP
An Alphonso study of July smart TV households confirmed that most “OTT viewers have far from abandoned linear” (Mediapost; 8/21/20) The analysis compared today’s “stay-at-home” viewing patterns to a January/February pre-pandemic baseline. Most streamers (95%) watch broadcast, basic cable, cable news, and sports on linear. Looking just at OTT other than Netflix, viewership levels are back to pre-pandemic levels. Since the summer months generally have lower viewing than the winter, as pointed out in the comments below the article, these levels could be seen as higher than anticipated.
AD SPENDING
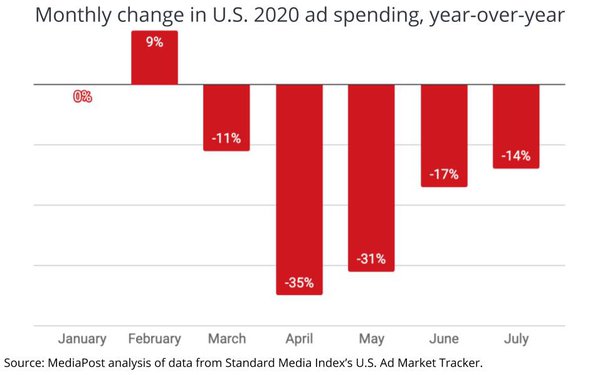
Mediapost (8/21) reported a 14% year-over-year decline for US Advertising in July, according to the US Ad Market Tracker produced in conjunction with Standard Media Index. With a more modest rate of erosion vs. the previous three months, the July data is a positive indicator that the ad recession may be bottoming out.
POLITICAL ADVERTISING
Federal election disclosures showed that both campaigns stepped-up campaign spending in July (nytimes.com; 8/21/20). According to the filing, Biden spent $46 million on TV and other media in July; over 60% more than June. The Trump campaign’s total for July was $44 million; approximately 25% more than the prior month. A linked graphic reflecting cash-on-hand (at the end of July), indicates that the Biden and Trump have $99 million and $121 million, respectively. While Biden has been outspent to date ($323 million vs. $230 million), the article reports that the former Vice President plans to increase ad spending in the coming months; potentially making this the most expensive face-off U.S. election in history.
SUPER BOWL LV
In line with 2020 pricing, CBS, the host of next year’s Super Bowl is seeking around $5.5 million for a 30-second in-game spot (Wall Street Journal; 8/20/20.) The network is reportedly requiring advertisers to participate in the digital stream of the game at an additional $200 thousand. Should the league need to end the season in advance of the big game, ad buyers are looking for a way out of their commitments rather than taking on make goods for the lost rating points.
DIY ICE CREAM (CLUB) SANDWICH
As the summer draws to a close, we’re following up last week’s Good Humor news with an easy DIY at-home recipe we saw on Good Morning America … The triple-decker frozen waffle masterpiece created by Chef George Duran. Three waffles form the “bread” of this dessert version of a club sandwich, made with cleverly sliced ice cream, frozen fruit, sprinkles, chocolate syrup, and whipped cream. Enough said. (Good Morning America; 8/25/20.)

