U.S. AD ECONOMY
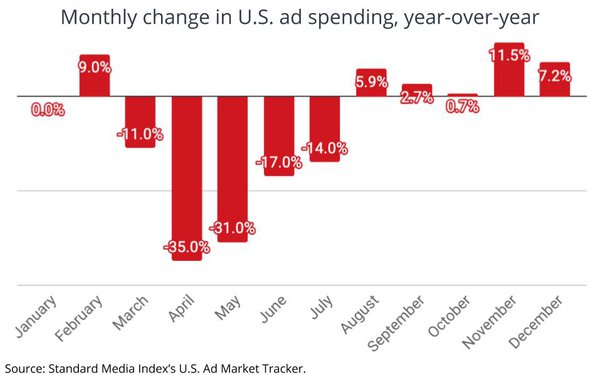
According to U.S. Ad Market Tracker (powered by Standard Media Index’s Cross Platform Product), the U.S. advertising economy had its fifth consecutive month of expansion in December, rising 7.2% over December 2019. The data, generated by actual media buys and major agency holding companies, appears to have rebounded from the effects of the 2020 COVID-19 pandemic. However, not all media benefited evenly. National TV declined 9.7%, while digital media saw a 30.7% year-over-year increase. Many brand marketers have shifted more of their budgets toward digital, especially for ecommerce and performance media buys. The top 10 ad categories surged 9.5% year-over-year in December; the driving force of this continued expansion. (MediaPost: 1/22/21)
LOCAL TV NEWS
Due to social unrest, a presidential election and crucial pandemic updates, TV news across local, national, and cable demanded a growing share of live TV viewing for much of 2020. According to Nielsen, November 2020 saw 44% of 13.1 billion live gross impressions go to TV News content; well above that from the year prior (30.5%). These figures are consistent with April’s TV news high 45% share of 14.3 billion live gross impressions, the first full month of COVID-19 in the U.S. and economic turmoil. Local news content continues to be strong, and will become highly important and more valued when it comes to local TV stations producing news content. (MediaPost: 1/21/21)
YOUNGER AUDIENCES AND THE NEWS
Younger demographics are turning to local news stations fueled by the events of the past year, including the pandemic, the Black Lives Matter movement, and most recently the Capitol Hill riots. Among 18-24 year-olds, local news has sky-rocketed year-over-year by 100%, while national news broadcasters also saw an increase of 50% in this demographic. “News is the bread and butter for local TV – so the fact younger audiences are watching more news now is an incredible opportunity,” Catherine Herkovic, VP MD Local Television, Nielsen. Broadcasters have launched their own GEN-Z and Millennial-oriented local news stations, which have seen double-digit increases in the 18-24 demo. As the need for distraction and entertainment continues to grow people are consuming more TV and the medium has become a major resource for many. (Variety: 1/20/21)
STREAMING CHURN
According to the LA times report of an October Deloitte study, 46% of respondents cancelled at least one streaming service within the last six months; a big increase over the 20% reported at the start of 2020. Reasons for this increased “churn” may be due to the cost of streaming services, a deal that may have expired, and programming. From a content perspective, services like Hulu, Netflix and Amazon are believed to be better equipped to handle the churn and remain top contenders in their category due to their continued programming. Those that may have more difficulty include Disney+, HBO Max and Apple TV+, as a steady stream of franchises are needed to help fight the churn. (TVREV: 1/19/21)
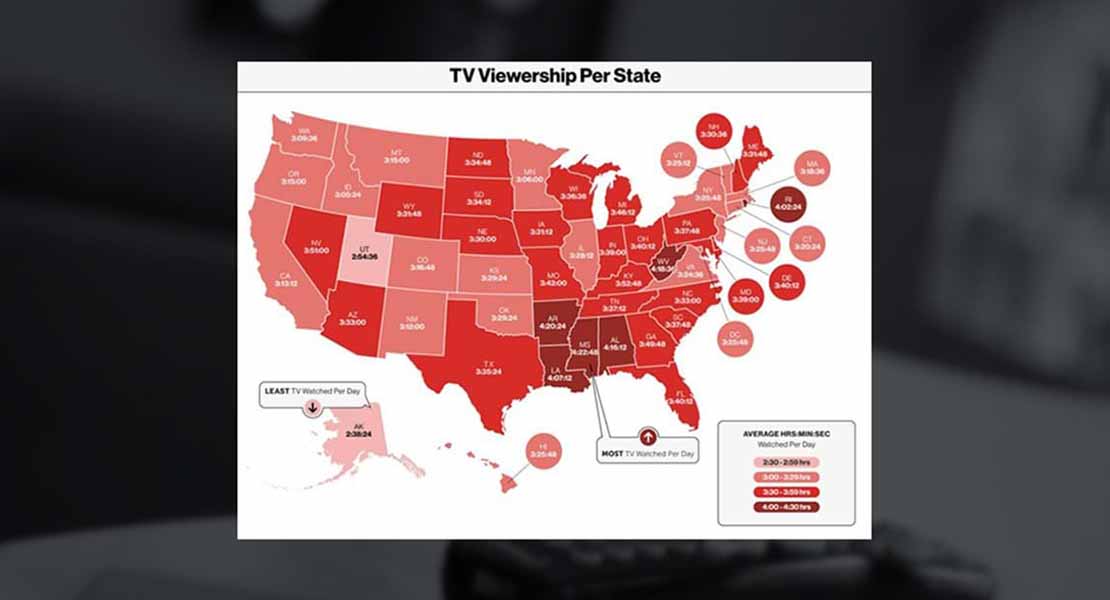
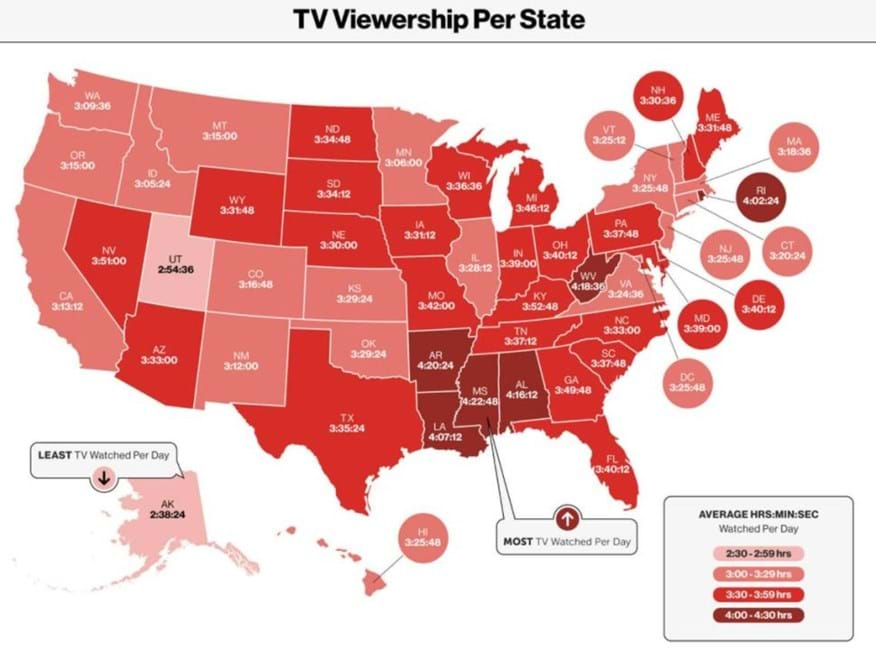
TV VIEWERSHIP PER STATE
Overall, Americans watched 17% more TV in 2020 than they did in 2019, according to a state-by-state analysis by Verizon. Mississippi led the way with a daily average of nearly 4 hours and 23 minutes. Rounding out the top 10 (in hours:mins:secs) are Arkansas (4:20:24), West Virginia (4:18:36), Alabama (4:16:12), Louisiana (4:07:12), Rhode Island (4:02:24), Kentucky (3:52:48), Nevada (3:51:00), Georgia (3:49:48) and Michigan (3:46:12). Of note, Rhode Island experienced a 45% year-over-year increase bringing it up from 15th place, while Delaware, West Virginia, and Lousiana dropped from their top three places in 2019. And the state with the lowest average viewing time? Alaska came in with only two hours and 38 minutes (TV TECH: 1/25/21).

